Drying time tables guide dehydrator use‚ linking temperature‚ humidity‚ and food type to optimal drying periods. They help users plan schedules‚ avoid spoilage‚ and maintain flavor. A well‑structured table‚ often shared as a PDF‚ supports consistent results. The PDF format ensures portability.!!
Purpose of a Drying Time Table
Drying time tables are indispensable tools that translate the intricate relationship between temperature‚ humidity‚ and food composition into clear‚ actionable schedules for dehydrators. By aggregating laboratory data‚ field observations‚ and industry best practices‚ these tables allow users to estimate the exact duration required for a specific food item to reach a target moisture level that guarantees safety‚ palatability‚ and shelf life. For hobbyists‚ a reliable table means consistent results across batches‚ while for commercial operators it provides a repeatable process that can be audited and scaled. The tables also serve as a risk mitigation framework: over‑drying can strip essential oils and nutrients‚ producing brittle or chalky textures‚ whereas under‑drying leaves residual moisture that invites mold growth and rapid spoilage. Accurate timing helps maintain the delicate balance between preservation and quality. In regulated markets‚ documented drying schedules demonstrate compliance with food‑safety standards‚ enabling traceability and certification. Additionally‚ drying tables educate users about the science of dehydration. They illustrate how variables such as initial moisture content‚ slice thickness‚ pre‑treatment methods (blanching‚ salting‚ or enzymatic treatment)‚ and equipment design influence drying kinetics. By comparing predicted times with actual results‚ users can refine their techniques‚ troubleshoot anomalies‚ and optimize energy consumption. Ultimately‚ a well‑constructed drying time table is a bridge between empirical data and practical application‚ empowering individuals and businesses to produce safe‚ high‑quality dried foods efficiently and sustainably. Its concise format also facilitates quick reference during batch preparation‚ reducing downtime and ensuring that each product meets the desired texture and flavor profile without unnecessary energy expenditure!
Key Parameters in Drying
Drying performance hinges on a handful of interrelated variables that together dictate how quickly water is removed and how the food’s structure‚ flavor‚ and safety evolve. The primary parameters are: temperature‚ which drives the vapor pressure gradient and determines the rate of moisture diffusion; relative humidity of the drying air‚ which moderates the moisture flux and can either accelerate or stall the process; airflow velocity‚ which ensures uniform exposure and prevents condensation on product surfaces; and product characteristics such as initial moisture content‚ density‚ and cut size‚ all of which influence the internal diffusion path. Secondary factors—pre‑treatment steps like blanching‚ salting‚ or enzymatic inhibition‚ the use of oxygen‑scavenging agents‚ and the geometry of the drying chamber—can fine‑tune the outcome. Accurate measurement and control of these parameters‚ often recorded in a drying time table‚ allow operators to predict final moisture levels‚ avoid over‑drying that degrades nutrients‚ and prevent under‑drying that invites microbial growth. By systematically varying one variable while holding others constant‚ researchers derive empirical correlations that feed into the PDF tables‚ enabling both novice and professional users to design efficient‚ reproducible dehydration protocols. Integrating this table into a digital workflow lets users iterate fast‚ cut waste‚ scale operations while preserving consistent quality across products.!
Common Foods Suitable for Dehydration
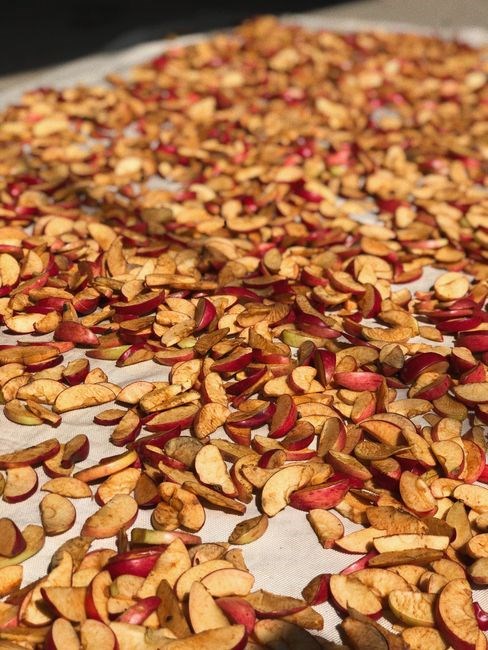
Dehydration preserves a wide array of foods‚ from fruits and vegetables to meats and herbs. Fruits such as apples‚ apricots‚ berries‚ mangoes‚ and raisins lose moisture rapidly‚ retaining sweetness and nutrients. Vegetables—including tomatoes‚ bell peppers‚ zucchini‚ carrots‚ onions‚ and leafy greens—benefit from drying‚ which concentrates flavor and extends shelf life. Herbs like basil‚ oregano‚ thyme‚ and rosemary dry to crisp‚ aromatic powders or whole leaves‚ ideal for seasoning. Meats such as beef‚ pork‚ chicken‚ and fish can be dehydrated into jerky or fish flakes‚ offering high‑protein‚ low‑fat snacks. Mushrooms‚ seaweed‚ and legumes also respond well‚ producing chewy textures or concentrated powders. Even dairy derivatives‚ like cheese‚ can be dehydrated into cheese crisps. The key is selecting items with moderate initial moisture‚ good structural integrity‚ and minimal oil content to avoid rancidity. Proper pre‑treatment—blanching‚ salting‚ or enzyme inhibition—ensures color retention‚ texture‚ and safety. By incorporating these foods into a drying time table‚ users can tailor temperature‚ humidity‚ and duration to achieve optimal moisture removal while preserving sensory qualities and nutritional value. This approach supports both small‑scale home preservation and industrial production‚ ensuring consistent‚ safe‚ and flavorful dried products. These guidelines help maintain color‚ texture‚ and making dried foods a versatile pantry staple.
Temperature Ranges for Different Foods
Food dehydration demands precise temperature control to balance moisture removal‚ enzyme activity‚ and quality preservation. For most fruits‚ a range of 55–65 °C (131–149 °F) is optimal; lower temperatures prolong drying time but better retain color and nutrients‚ while higher temperatures risk browning or nutrient loss. Vegetables such as carrots‚ zucchini‚ and bell peppers are typically dried at 60–70 °C (140–158 °F)‚ ensuring crisp texture and minimal shrinkage. Leafy greens and herbs‚ which are delicate‚ benefit from 45–55 °C (113–131 °F) to preserve volatile aromas and avoid excessive drying that leads to brittleness. Meats‚ including beef jerky‚ pork‚ and chicken‚ require higher heat to eliminate pathogens; temperatures of 70–80 °C (158–176 °F) are common‚ with a final hold at 80 °C for 15–20 minutes to guarantee safety. Fish and seafood‚ being prone to spoilage‚ are best dried at 65–75 °C (149–167 °F)‚ balancing rapid moisture loss with flavor retention. Mushrooms and seaweed‚ rich in moisture‚ are dehydrated at 55–60 °C (131–140 °F) to preserve umami compounds. Legumes and grains‚ which contain higher starch‚ often need 60–70 °C (140–158 °F) to achieve a firm‚ dry product without excessive heat damage. When designing a drying time table‚ these temperature brackets guide settings that match texture safety. Adjustments for altitude‚ equipment‚ or batch size are possible‚ but the ranges give a quality baseline for consistent‚ quality dried foods. !!
Humidity Levels and Their Impact
Humidity‚ measured in relative percent‚ is a decisive factor in drying efficiency. High ambient moisture slows water removal by creating a diffusion barrier‚ extending drying time and increasing energy consumption. Low humidity accelerates moisture loss by creating a diffusion barrier‚ but excessive dryness can cause surface hardening‚ leading to uneven drying and potential nutrient loss. Optimal ranges vary by food type: fruits and herbs thrive at 30–50 % RH‚ while meats and fish require 20–40 % RH to prevent microbial growth. In a controlled dehydrator‚ maintaining RH below 40 % ensures rapid moisture extraction while preserving color and flavor. Monitoring humidity with hygrometers allows real‑time adjustments; for instance‚ a sudden spike may trigger a fan or a brief temperature increase to restore balance. In high‑altitude settings‚ lower atmospheric pressure reduces effective RH‚ so operators often compensate by lowering set temperatures to avoid scorching. Humidity also influences rehydration properties; products dried at moderate RH retain better texture upon rehydration. Therefore‚ a well‑designed drying time table must incorporate RH thresholds‚ linking them to temperature and food category. By integrating humidity control‚ dehydrators achieve consistent quality‚ extended shelf life‚ and energy savings. This holistic approach is essential for commercial and home applications alike.
By fine‑tuning RH‚ operators can reduce drying times by up to 25 %‚ cutting energy costs t keep flavorand texture.
Pre-treatment Techniques (Blanching‚ Spraying)
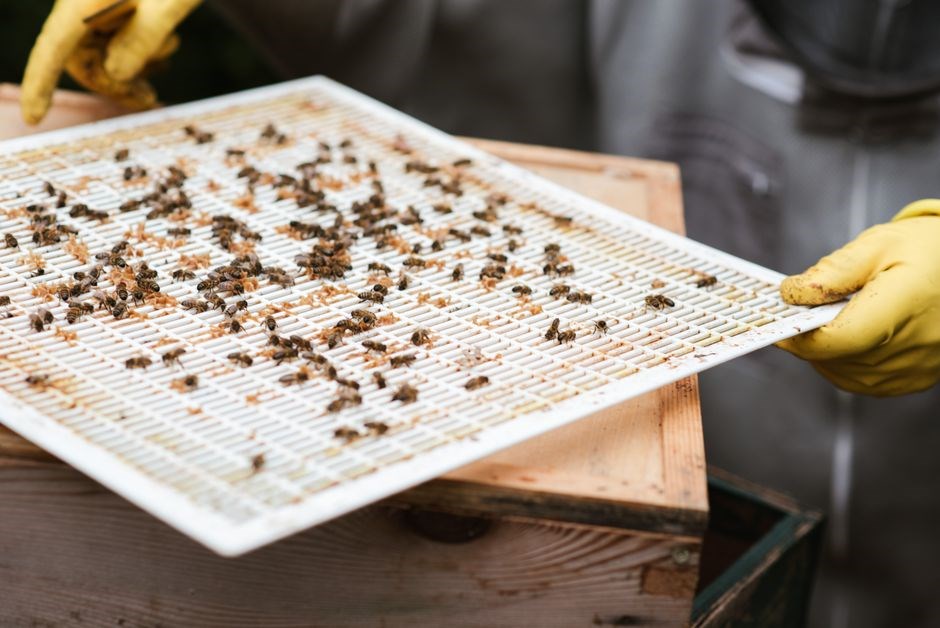
Pre‑treatment is the first step that determines the final quality of dried products. Blanching‚ a immersion in boiling water or steam‚ deactivates enzymes that would otherwise cause oxidation and color loss; Typical times range from 30 seconds for leafy greens to 2 minutes for root vegetables‚ followed by rapid cooling in ice water to halt the process. Spraying‚ on the other hand‚ involves applying a thin coat of solution—salt‚ sugar‚ or an antioxidant blend—to the surface before drying. This technique not only enhances flavor but also creates a protective barrier against moisture migration‚ reducing the risk of rehydration during storage. For fruit slices‚ a 0.5 % ascorbic‑acid spray can preserve bright hues for up to 12 months. In legumes‚ a 1 % sodium‑bicarbonate rinse removes phytic acid‚ improving digestibility. The choice of pre‑treatment depends on the target product‚ desired shelf life‚ and the dehydrator’s temperature range. A blanch‑spray sequence can cut drying time by 15–20 % while maintaining nutritional integrity. When integrating these steps into a PDF drying‑time table‚ each item should list the recommended blanch duration‚ spray concentration‚ and the resulting moisture content target. This structured approach ensures consistency across batches and simplifies troubleshooting for operators. Additionally‚ blanching can be performed in a setup for temperature control‚ reducing usage. Spraying solutions may include preservatives such as rosemary extract‚ which extends shelf life by inhibiting microbial growth. Operators should calibrate spray nozzles to deliver 0.2 ml per square centimeter‚ ensuring coverage. Documentation of each pre‑treatment step in the PDF table aids traceability and compliance with food safety. All steps are!
Interpreting the Drying Time Table
When you open a PDF drying‑time table‚ the first column lists the food item‚ the second the recommended temperature‚ the third the target moisture percentage‚ and the fourth suggested drying duration. The table is built on empirical data collected from multiple trials‚ so each entry is a balance between safety‚ flavor‚ and texture. To interpret it‚ start by matching your product to the first column; if you have a composite item‚ use the closest match and adjust the time by ±10 % based on batch size. Next‚ check the temperature column—most dehydrators operate between 120 °F and 170 °F; the table will specify the exact setting that preserves nutrients while preventing over‑drying. The moisture column indicates the final water activity; for most fruits‚ 12 %–15 % is ideal‚ whereas leafy greens may require 20 %–25 %. Finally‚ the time column is the baseline; if you notice a higher initial moisture content‚ add 5 minutes per 10 % increase. Always monitor the product visually; a translucent appearance signals readiness‚ while a brittle texture suggests over‑drying. Use the table as a guide‚ not a strict rule—environmental humidity‚ oven calibration‚ and pre‑treatment steps can shift the outcome. Document any deviations in a log; this data refines future tables and ensures consistency across batches. Remember‚ the goal is to achieve a safe‚ palatable product with minimal waste. By following these guidelines‚ dried foods taste stable for years now!!!!!!!..!!.!!!!!!
Designing a Drying Time Table
Creating a reliable drying‑time table begins with a systematic data collection phase. First‚ select representative samples of each food type you intend to dehydrate. Record initial moisture content using a calibrated moisture meter or oven‑dry method. Next‚ run a series of drying trials across the temperature spectrum your dehydrator can provide‚ typically 120 °F to 170 °F. For each trial‚ log the time required to reach the target moisture level‚ noting any visual cues such as color change or firmness. After gathering sufficient data points‚ apply regression analysis to model the relationship between temperature‚ time‚ and final moisture. The resulting equation allows you to interpolate drying times for intermediate temperatures or different batch sizes. When drafting the table‚ include columns for food name‚ recommended temperature‚ target moisture‚ and calculated drying time. Add a safety margin column—usually 5 %–10 % longer than the calculated time—to accommodate equipment variability. Finally‚ validate the table by running a test batch using the prescribed settings; adjust the parameters if the product is under‑or over‑dried. Document each iteration‚ and update the PDF whenever new data emerges. This iterative approach ensures the table remains accurate‚ user‑friendly‚ and compliant with food safety standards. It also facilitates training for new staff and supports quality control audits. This table is a living document‚ refined as new data arrives daily.
Generating the Table in PDF Format
Once the drying‑time matrix is finalized‚ converting it into a portable document ensures consistency across devices and facilitates sharing with stakeholders. Begin by exporting the table from your spreadsheet or database as a CSV or Excel file. Use a word processor or desktop publishing tool—Microsoft Word‚ LibreOffice Writer‚ or Google Docs—to import the data and format it into a clean‚ readable layout. Pay attention to column alignment‚ font size‚ and header styling; a 10‑point Calibri or Arial font is widely accepted for technical tables. After the visual design is complete‚ employ the built‑in “Save As” or “Export” function to generate a PDF. For higher fidelity‚ consider a dedicated PDF creator such as Adobe Acrobat Pro‚ which offers advanced options like compression‚ watermarking‚ and metadata tagging. When embedding the table‚ include a brief legend that explains temperature units‚ moisture targets‚ and any safety margins. Add page numbers and a header that lists the document title and revision date to aid version control. Finally‚ validate the PDF by opening it on multiple platforms—Windows‚ macOS‚ and a mobile device—to confirm that the table renders correctly and that hyperlinks‚ if any‚ function as intended. Once verified‚ distribute the PDF via email‚ cloud storage‚ or a company intranet‚ ensuring that all users have access to the most current drying‑time reference. (±5 min est)
Software Tools for PDF Creation
When converting a drying‑time table into a shareable PDF‚ several software options provide reliable results. The process ensures consistency across different devices and formats. Desktop word processors such as Microsoft Word and LibreOffice Writer allow users to import spreadsheets‚ format tables with precise cell borders‚ and then export directly to PDF with minimal loss of fidelity. Google Docs offers a cloud‑based alternative; after inserting the table‚ the “Download as PDF” function preserves layout and can be accessed from any device. For users who require advanced editing‚ Adobe Acrobat Pro DC provides features like adding watermarks‚ embedding metadata‚ and applying compression to reduce file size without compromising readability. Free‚ open‑source tools such as PDFCreator and PDFsam Basic can also generate PDFs from any printable document‚ though they may lack the fine‑grained styling controls of proprietary suites. When choosing a tool‚ consider the need for batch processing‚ compatibility with existing workflow software‚ and the ability to maintain consistent font usage across multiple tables. Regardless of the platform‚ always preview the final PDF on at least two different operating systems to ensure that column widths‚ header styles‚ and page breaks render correctly for all end users. This diligence guarantees that the drying‑time reference remains a dependable resource for technicians and hobbyists alike.
Common Troubleshooting Issues
When using a drying‑time table in PDF form‚ several pitfalls can undermine its effectiveness. First‚ the table may display incorrectly on certain devices due to font substitution; ensuring that the PDF embeds all fonts prevents missing glyphs that could misrepresent temperature or time values. Second‚ if the dehydrator’s actual temperature deviates from the table’s prescribed range‚ the food may over‑dry or remain moist; calibrating the unit with a reliable thermometer before use is essential. Third‚ high ambient humidity can extend drying times beyond what the table predicts; incorporating a hygrometer into the drying chamber allows real‑time adjustments. Fourth‚ the table’s layout might be distorted when printed on smaller paper sizes; using the “fit to page” option in the PDF viewer or re‑exporting with adjusted margins mitigates this. Fifth‚ users sometimes misinterpret column headings‚ especially when the table lists both “time” and “duration” in different units; adding a legend clarifies the distinction. Finally‚ if the PDF was created from a spreadsheet with merged cells‚ the resulting table may lose data integrity when converted; always unmerge cells before exporting. By addressing these common issues‚ technicians can rely on the PDF table for accurate‚ repeatable drying schedules. Moreover‚ documenting each adjustment in a logbook helps trace performance trends and refine future schedules. These practices keep the dehydrator within safe limits‚ preserving nutrients and extending shelf life!!
Equipment Maintenance Tips
Regular upkeep of the dehydrator keeps the drying‑time table accurate and the PDF output reliable. Start by inspecting the heating element: look for discoloration or cracks that can cause uneven temperatures. Clean the trays and racks with warm‚ soapy water‚ then rinse and dry to prevent residue buildup that may alter airflow. Verify the thermostat by comparing the built‑in sensor to an external thermometer; mismatches can skew the time table. Keep the fan assembly free of dust—use a soft brush or compressed air. Periodically check the humidity sensor if the unit has one; recalibrate it according to the manufacturer’s guidelines. Ensure the ventilation ports are unobstructed— a blocked vent can raise internal humidity and extend drying times beyond the PDF schedule. Finally‚ store the dehydrator in a dry‚ cool place when not in use‚ and cover it with a breathable cloth to avoid dust accumulation. By following these steps‚ the machine will maintain consistent performance‚ and the PDF drying‑time table will remain a trustworthy reference for future batches.
Additionally schedule a quarter check of the heating element for wear. Document any changes in drying times and compare them against the PDF table to detect drift. If the table’s predictions no longer match reality‚ recalibrate the unit or replace worn parts. A well‑maintained dehydrator not only preserves food quality but also extends the lifespan of the equipment‚ ensuring reliable use for years to come.

Storage Advice for Dried Foods
Proper storage preserves the flavor‚ texture‚ and safety of dehydrated items. Keep dried fruits‚ herbs‚ and meats in airtight containers—glass jars‚ vacuum‑sealed bags‚ or high‑quality plastic tubs—to block oxygen and moisture. Label each container with the product name‚ drying date‚ and the time‑table reference from the PDF to track freshness. Store in a cool‚ dark place; ideal temperatures range from 50°F to 60°F (10°C to 15°C). Avoid exposure to direct sunlight or heat sources‚ as light can degrade vitamins and cause rancidity. For long‑term storage‚ consider a cool‚ dry pantry or a dedicated dry‑food cabinet. If you live in a humid climate‚ add desiccant packets to absorb residual moisture; replace them every six months. Periodically inspect stored items for signs of mold‚ off‑odors‚ or insect activity; discard any compromised batches immediately. For bulk quantities‚ rotate stock using a first‑in‚ first‑out system‚ and keep a log of drying dates and consumption. When rehydrating‚ follow the PDF’s recommended soaking times to ensure safety and optimal texture. By adhering to these practices‚ you extend shelf life‚ maintain quality‚ and reduce waste.
Use a calibrated probe to check the dehydrator’s internal temperature before each batch. Record the start and end readings to verify the PDF’s suggested times. If the temperature differs by more than five degrees Fahrenheit‚ adjust the heat or extend the drying period. This check ensuresgood quality.